2,735 orders and $117,789 in revenue in five months
Hypothesis testing, creative rotation and winner scaling for Iris Aroma
Iris Aroma (irisaroma.com) is a Ukrainian manufacturer of home fragrance products — reed diffusers, laundry perfumes, textile sprays, car fragrances, body perfumes and gift sets, with 171 SKUs recording sales over the period. The business sells online only: no retail, no wholesale, no marketplaces. Every order comes through the website, which makes paid traffic the single lever on revenue. I took over the account on 13 March 2026; this case covers work through 24 August 2026.
- META ADS
- GOOGLE ADS
- ECOMMERCE
- UKRAINE
- 171 SKUS
- CREATIVE TESTING
- SCALING

What the account looked like before
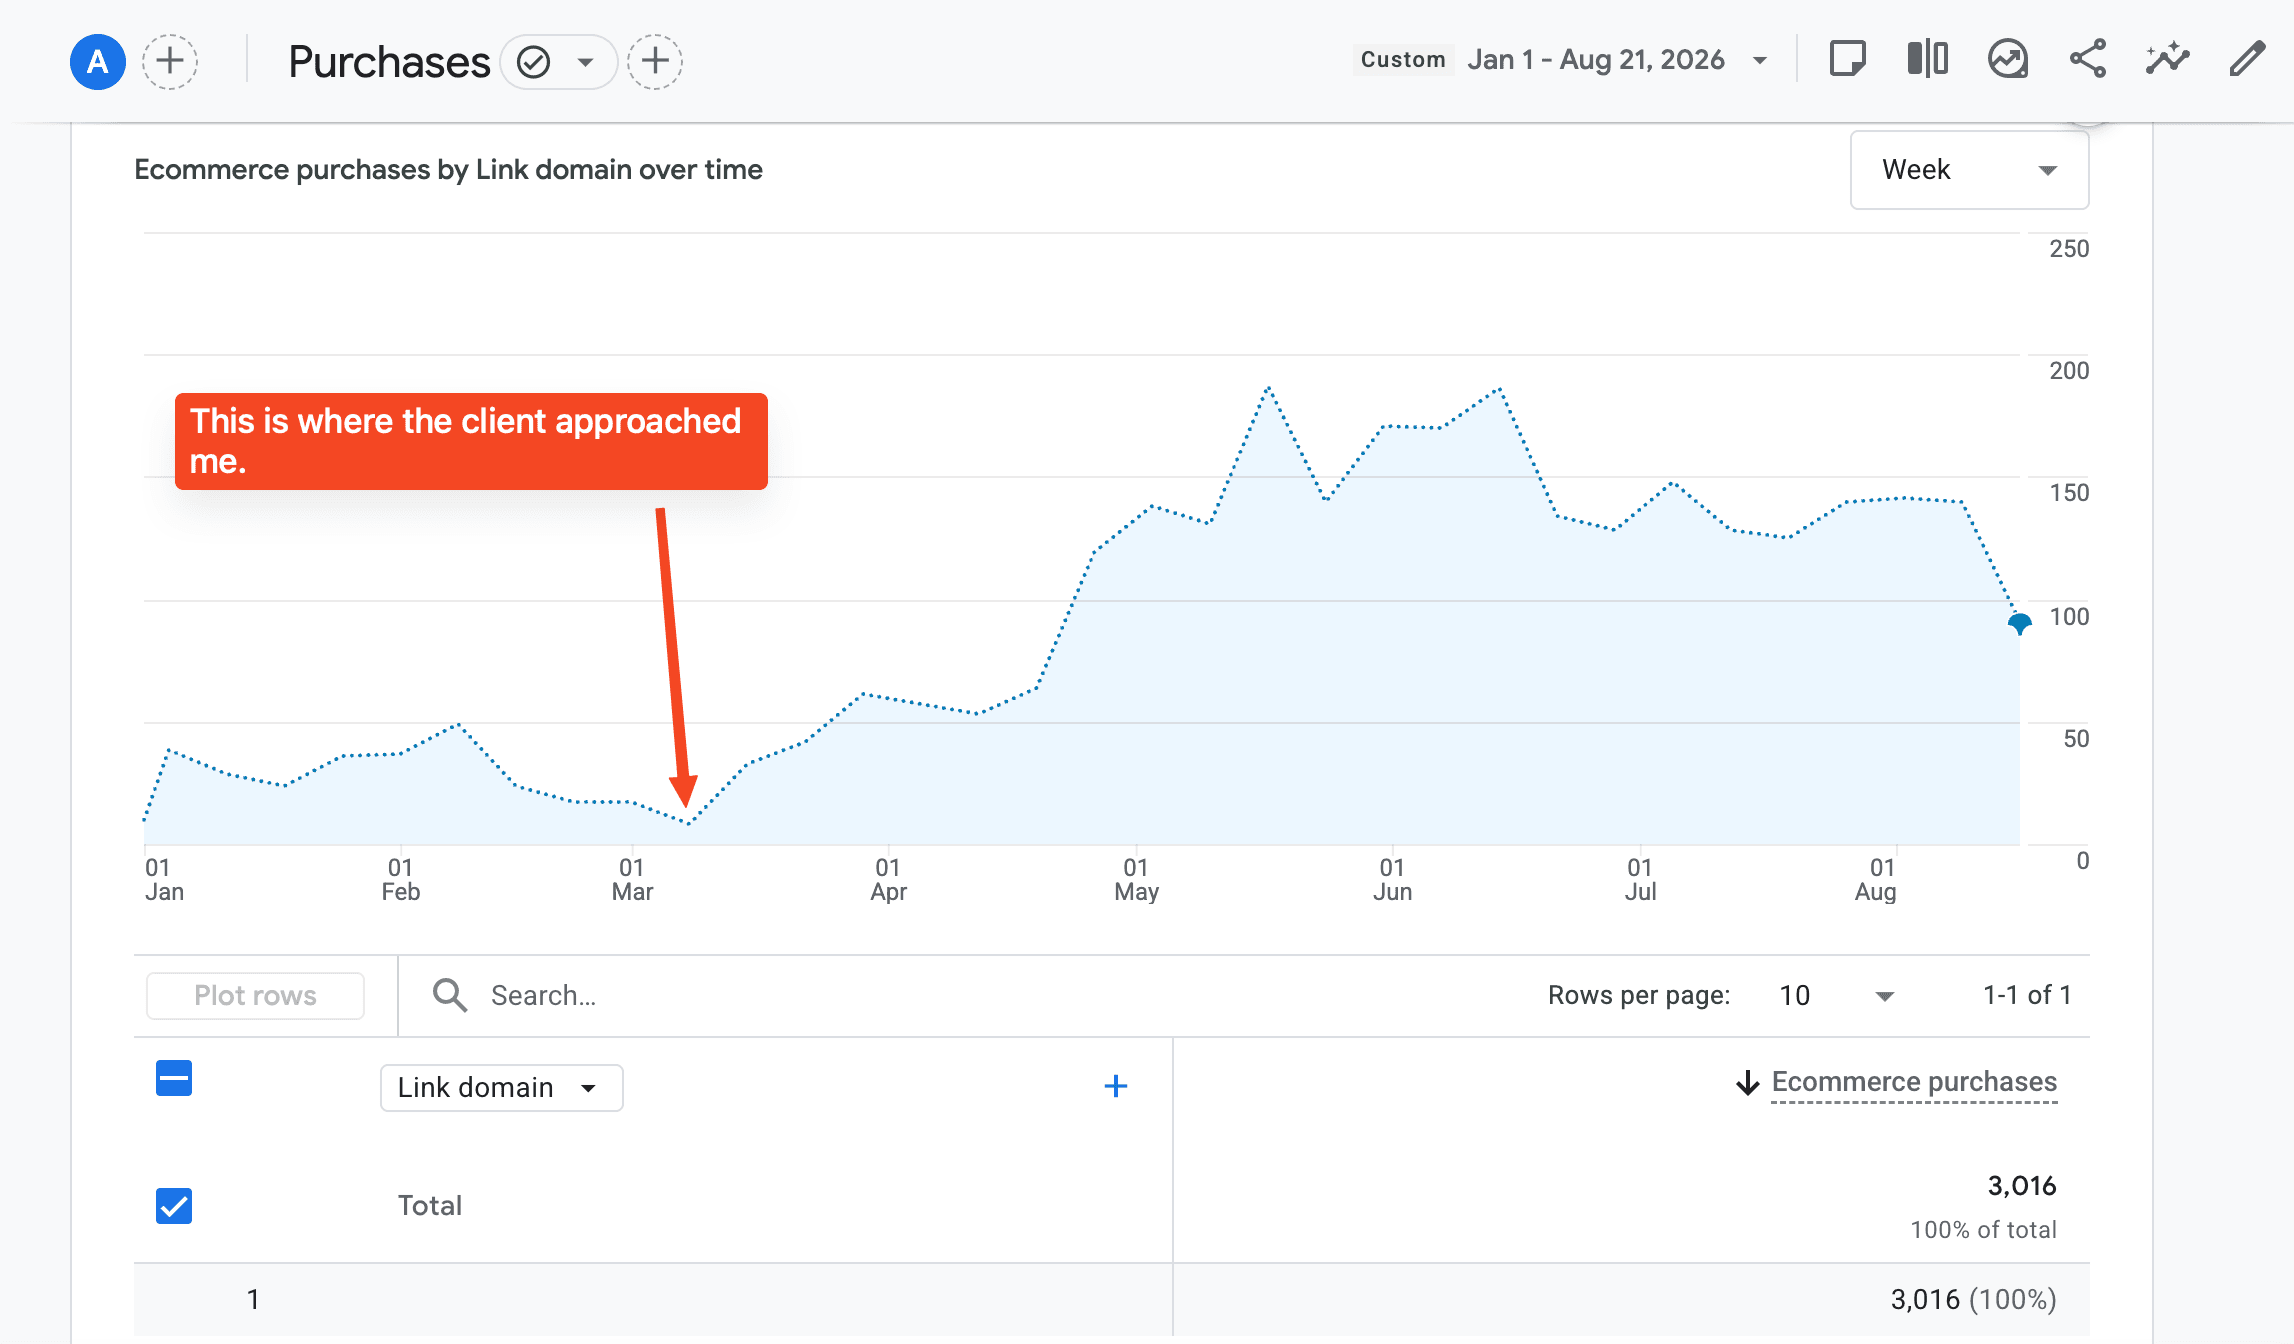
Iris Aroma came to me during a sharp drop in sales. With no offline channel to fall back on, the drop hit the whole business, not one line of it. The two months before I started, January and February 2026, looked like this:
- Meta Ads: $1,285.54 spent, 151 website purchases, ROAS 4.02, CPA $8.51 — 10 distinct ads across 3 campaigns
- Google Ads: $1,687 spent, 111 conversions, ROAS 3.60, cost per conversion $15.19
- Combined paid: $2,972 spent, 262 purchases, ROAS 3.78 — an average of 131 paid purchases a month
What was broken was not the return. It was everything feeding it:
- Campaigns pushed one high-priced gift item people buy occasionally as a present — the rest of the catalogue wasn't advertised at all
- Objectives were set to Traffic and Messages, while 90–95% of orders close on the website
- Targeting was a handful of interest audiences restricted to the largest cities
- Each campaign ran a single creative — with no variants, no creative-audience combination could ever be identified as a winner
The challenge
The account was not losing money. It was stuck at a volume the business could not live on: 131 paid purchases a month from a catalogue of 171 selling SKUs, one product carrying the ads and one creative carrying the product.
That rules out the standard efficiency playbook. There was no wasteful spend to cut and no broken ROAS to repair. The only route to more revenue was more volume — and volume is where ecommerce accounts usually break, because ROAS decays as spend climbs.
A second constraint was the client's own read on the market: they were certain summer is the weak season and real sales arrive in autumn and winter. Scaling into March–August meant scaling into the months the client expected to lose money in.
Established which products actually sell
Before touching campaign structure, I needed to know what to advertise. A catalogue that size cannot be launched at once, and picking wrong on the first pass costs the test budget that scaling depends on.
- Pulled the full product-level breakdown from the site admin panel
- Reconciled it line by line against the GA4 item report to confirm the two sources agreed
- Identified the categories carrying real volume: laundry perfumes, reed diffusers and textile sprays — not the single high-priced gift item the old setup was pushing
- Agreed a standing arrangement for regular creative refreshes, so the account always had new material to test
Verified the tracking base before relaunch
I audited event tracking before rebuilding anything, on the principle that a pixel learning from bad data will optimise toward the wrong people no matter how good the structure above it is.
The audit came back clean: purchase events fired correctly and the pixel was training on accurate data. Nothing needed fixing — worth stating plainly rather than dressing up as a fix. The technical base was sound, and the checks confirmed it was safe to scale on top of it.
Rebuilt the structure and ran the first tests
- Replaced Traffic and Messages objectives with Sales campaigns optimising for website purchases — matching the objective to where 90–95% of orders actually close
- Rebuilt campaigns by product category — laundry perfumes, diffusers, textile sprays, car fragrances — so each category could be judged on its own numbers
- Launched three targeting approaches in parallel: Advantage+, interest-based, and retargeting
- Cut retargeting after several days — it accumulated data too slowly to judge inside the test window
- Interest-based became the volume engine: $18,829 spent for 1,751 purchases at ROAS 3.87 and CPA $10.75. Advantage+ ran alongside at $4,240 for 322 purchases, ROAS 3.35
Broad first, split second
Regional analysis showed the capital absorbing almost all traffic, capping how much of the country the account could reach. The pattern I settled on: new campaigns start broad, targeting all of Ukraine. Once a campaign proves itself, I split it into a Kyiv campaign and a rest-of-country campaign, so the capital stops crowding out the regions in a shared auction.
- Kyiv: $9,487 spent, 921 purchases, ROAS 4.00, CPA $10.30
- All-Ukraine: $8,840 spent, 784 purchases, ROAS 3.77, CPA $11.28
- Rest-of-country as a separate split: $633 spent, 37 purchases, ROAS 2.45, CPA $17.12
Kyiv is the strongest single geography in the account. The broad all-Ukraine campaigns — not the carved-out regional ones — are what gave the rest of the country its reach.
Scaled winners and kept the test lane running
- Launched extra campaigns duplicating winning creatives, so proven material could carry more budget without disturbing campaigns already learning
- Kept a permanent test lane open: new creatives and audiences launching continuously alongside the scaled campaigns
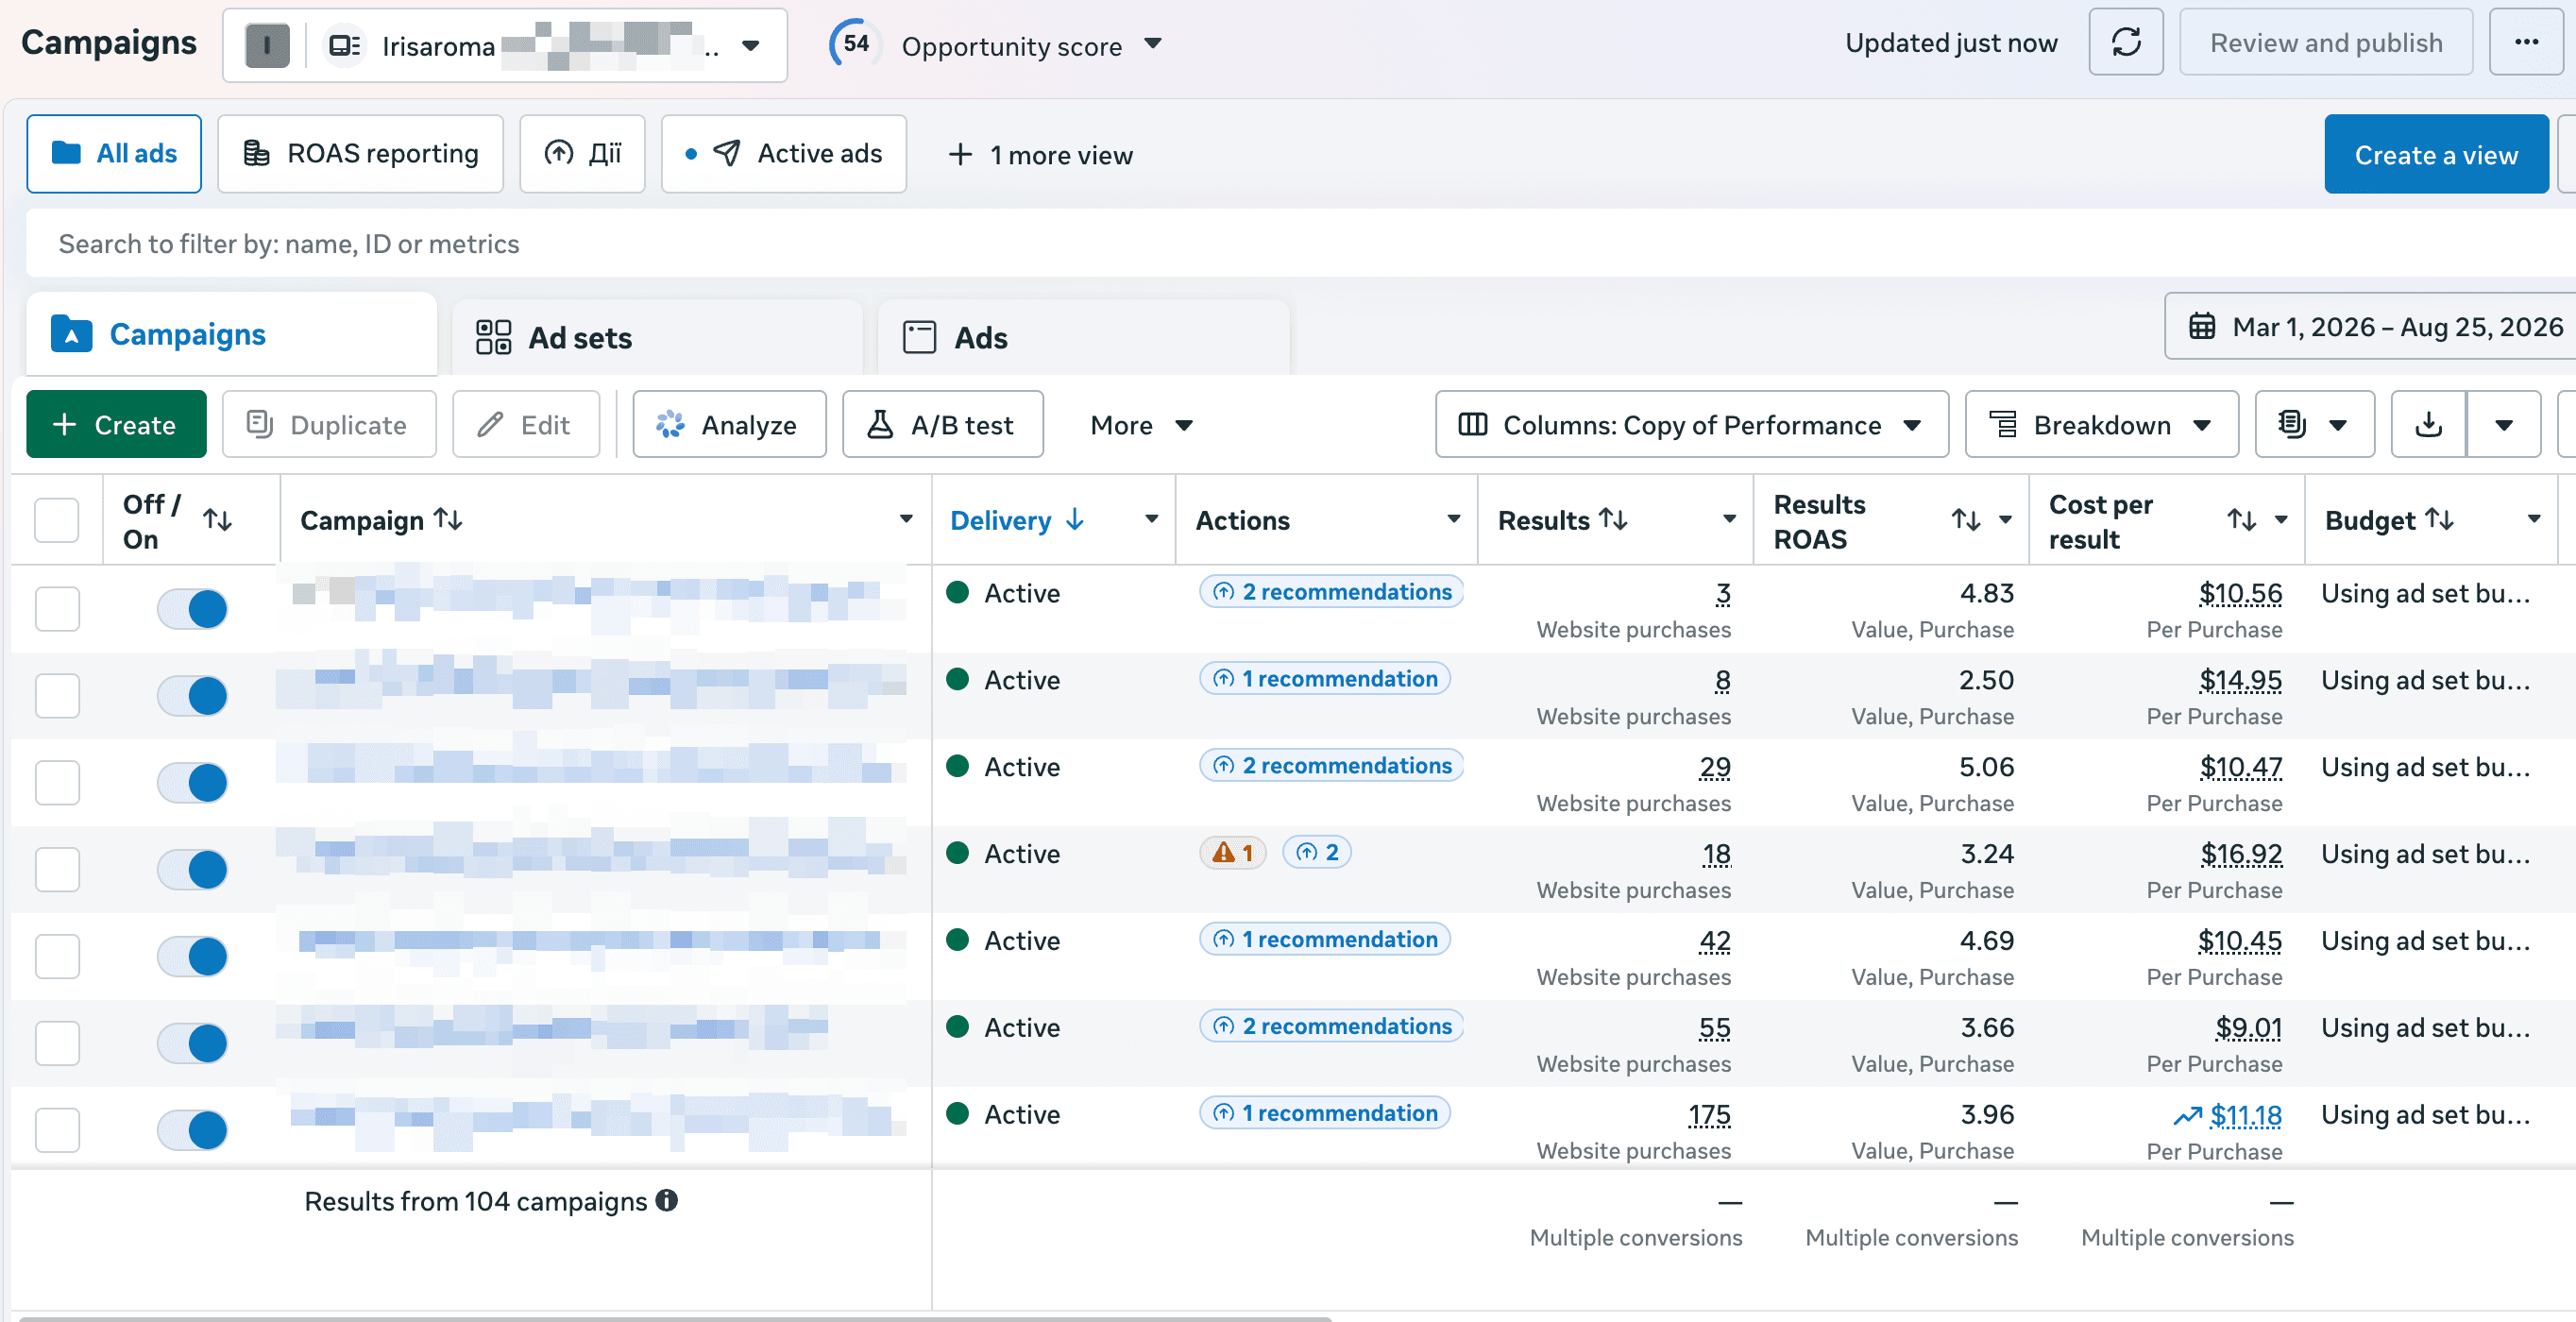
- Grew the creative pool from 10 ads across 3 campaigns to 67 ads across 47 campaigns
- Applied a hard cut rule: any ad falling below 2.5 ROAS was switched off
- The top five creatives by spend all held above 3.7 ROAS — the biggest, “Honey Melon”, took $2,952 for 401 purchases at ROAS 4.50
What did not work
Retargeting was paused: $349 for 21 purchases at ROAS 2.93 and CPA $16.63, against $10.75 on interest campaigns. It accumulated data too slowly to reach a verdict — a sample-size problem rather than a channel problem. It's queued for relaunch on a larger budget.
The dedicated rest-of-country geo split was the weakest structure tested: $633 for 37 purchases at ROAS 2.45. Budget stayed with the broad all-Ukraine campaigns instead.
Legacy campaigns inherited from the previous setup took $380 for 12 purchases at ROAS 1.77 before being switched off.
Results
Meta Ads, 1 March – 24 August 2026 (work started 13 March), against January–February 2026:
- Spend: $23,798 vs $1,286 — monthly rate up 6.9×
- Purchases: 2,106 vs 151 — 390 a month against 76, up 5.2×
- Purchase value: $88,746 vs $5,167
- ROAS: 3.73 against 4.02 · CPA $11.30 against $8.51
- Impressions: 3,034,178 against 245,540
- Ads in rotation: 67 across 47 campaigns, against 10 across 3
Google Ads over the same comparison: $2,921 spent against $1,687, conversions up from 111 to 221, ROAS 3.81 against 3.60, cost per conversion down from $15.19 to $13.22. Combined paid media: monthly spend rose 3.3× and monthly purchases rose 3.3×, with ROAS moving just 1.1%. The client's own monthly ledger, all channels:
| MONTH | ORDERS | REVENUE | AD SPEND | ROAS |
|---|---|---|---|---|
| March | 149 | $6,982 | $1,668 | 4.19 |
| April | 315 | $12,917 | $2,393 | 5.40 |
| May | 545 | $24,498 | $5,915 | 4.14 |
| June | 562 | $24,640 | $7,094 | 3.47 |
| July | 465 | $21,392 | $5,293 | 4.04 |
Orders per month grew 277% from March to June. Average order value held at $44 across March–July, so the growth came from order count, not basket size. And May, June and July — the months the client expected to be the weakest — turned out to be the three strongest of the period.
Why it worked
Volume was the constraint, not efficiency. The account was already returning around 3.8 ROAS. Reading that correctly meant the job was to add budget without breaking the return, not to chase a higher multiple on a small base. Diagnosing which of the two problems you actually have decides everything that follows.
Product data came before campaign structure. Reconciling the site admin sales export against GA4 before launch meant the first campaigns went out behind categories already proving themselves in the checkout — not behind the one product the account had defaulted to.
A permanent test lane is what makes scaling survivable. Creative fatigue is what caps a scaled ecommerce account. Running new creatives and audiences continuously alongside the scaled campaigns — 10 ads to 67 — meant there was always a replacement ready before the winner decayed.
Broad first, split second. Testing at the country level and splitting geography only after a campaign proves itself avoids fragmenting the learning phase across small audiences. The dedicated regional split underperformed — exactly the kind of finding a broad-first sequence surfaces cheaply.
Selling online only, with paid traffic as the single lever on revenue?
Book a free account audit — I'll pull your platform exports against your own sales ledger and show you where the volume is capped and what it costs to lift it.
Book a free account audit →